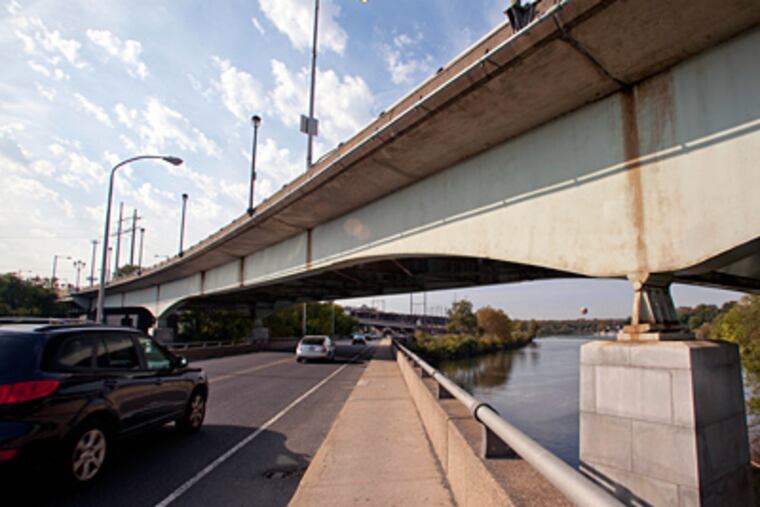
Philadelphia region ranks third in U.S. in deficient bridges
The Philadelphia region has the third-highest percentage of structurally deficient bridges among large U.S. metropolises, behind only Pittsburgh and San Francisco.

The Philadelphia region has the third-highest percentage of structurally deficient bridges among large U.S. metropolises, behind only Pittsburgh and San Francisco.
Data analyzed by Transportation for America, a group advocating for more spending on the nation's infrastructure, showed that 20 percent of the Philadelphia region's 4,500 bridges have significant deterioration.
The bridges are not unsafe, but many need prompt repairs or limits on the weight they can carry.
Pennsylvania continues to lead the nation in the number of bad bridges, with about 26 percent of its bridges structurally deficient.
New Jersey ranks 27th, slightly better than the national average, with 10 percent of its bridges structurally deficient.
Six of the troubled Philadelphia bridges are on I-95 between the Betsy Ross Bridge and Port Richmond, and they will cost an estimated $570 million to fix, part of a larger $1.4 billion tab for repairing that stretch of I-95, according to the Pennsylvania Department of Transportation.
Pennsylvania for years has been the nation's leader in structurally deficient bridges.
In 2008, the state launched an "accelerated bridge program" with a goal of repairing or replacing at least 1,145 bridges in three years. By the end of 2010, PennDot had fixed nearly 1,600 bridges, and it expects to repair 330 more by the end of this year.
Figuring out how to pay to rebuild I-95 through Southeastern Pennsylvania will be one of the biggest challenges for the Corbett administration as it looks for ways to increase funding for transportation projects.
Gov. Corbett has appointed a commission to find ways to pay for bridge, highway, and transit projects, and the panel in August gave the governor a plan for raising $2.5 billion in new revenue each year.
The plan advocates raising a component of the gasoline tax and increasing fees for driver's licenses and vehicle registrations.
Corbett has not moved to implement any of the commission's recommendations.
"The findings of the Transportation Funding Advisory Commission are still being evaluated by the governor's office," PennDot spokesman Dennis Buterbaugh said.
Pennsylvania has tripled its spending on bridge repairs since 2002 and has reduced the number of structurally deficient bridges from an all-time high of 6,034 in 2008 to 5,069 now, Buterbaugh said.
But the level of spending and repairs dropped this year, to 330 bridges from 647 last year and $600 million from $823 million. Buterbaugh attributed that decline to the end of federal stimulus spending.
After Pittsburgh (30 percent), San Francisco (21 percent), and Philadelphia (20 percent), the large metropolitan regions with the highest percentage of structurally deficient bridges were: Sacramento and Riverside, Calif.; Kansas City, Mo.; Boston; Detroit; Cleveland; and New York.
"The problem of deficient bridges in our metropolitan areas is a stubborn one that current transportation programs have not been able to address adequately," said the authors of the Transportation for America report, noting that the federal government was spending $5.2 billion a year on bridge repair, while the backlog is $71 billion.
The report called for "a fundamental shift in policy to ensure that we take care of our existing infrastructure. States should be required to show that they have taken care of what they have before they spend repair money on new capacity they can't afford to maintain."
The group analyzed bridge data compiled by the Federal Highway Administration in its National Bridge Inventory. The bridge data are from 2009, the most recent year available, the group said.
To see the data, go to: http://t4america.org/