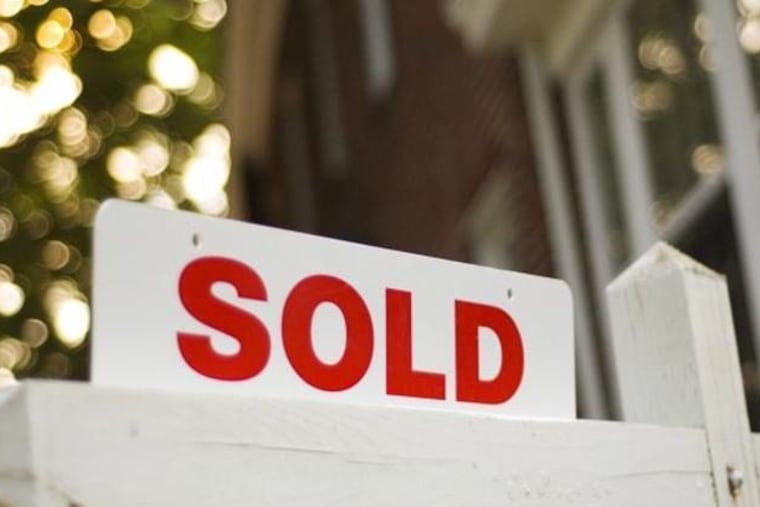
As COVID drives home prices higher, crunching the numbers on housing affordability | Rebuilding Philly
Before the pandemic struck, price tags in the city were beginning to rise. Now, a series of sharp increases threaten to put home buying out of reach for many Philadelphians, writes Kevin C. Gillen.
Even before the first case of COVID-19 was identified in our city, the price of a typical home in Philadelphia was increasing at a faster rate than the ability of a typical Philadelphian to pay for it.
Consider that as recently as 2016, Philadelphia’s median house price was $137,000 and its median household income was $41,500, which gives a housing affordability ratio of 3.3. Ratios greater than 3 indicate that house prices are more than three times local incomes, and hence households are likely to be spending more than 30% of their income on housing, which is the recommended benchmark in the Department of Housing and Urban Development’s affordability guidelines.
Rebuilding Philly
This suggests that the typical Philadelphia household is spending 33% of their income on housing costs. Although this is slightly higher than the government’s recommended threshold of 30%, it is not by much. Moreover, it is not uncommon for large cities to have slightly higher affordability ratios than suburban or rural areas.
But even before an aggressive price appreciation that followed COVID-19, this ratio had risen to 3.7 by 2019. In 2020, it rose to 3.9. And with Philadelphia’s current median house price of $223,000 and (projected) median household income of $50,100, the current ratio is 4.5. That is a whopping 36% increase in housing unaffordability in just five years.
Ratios and percentages aside, the raw numbers in real estate listings also tell this story. In Philadelphia, the median sales price has risen from $183,700 to $223,055; a 21% increase since 2020. In our suburbs, the increase was 25%. However, during this same period, household incomes in Philadelphia have almost certainly not experienced a comparable increase to offset the city’s new, higher cost of living (the most recent year for which income figures are available is 2019).
That all of this data suggest Philadelphia has become a less affordable city is a genuine policy concern in a city with as high a poverty rate — 23% — as ours. Unlike, say, New York or San Francisco — where the affordability ratio can be as high as 8, and even higher in those cities’ suburbs — we simply don’t have the higher levels of incomes to offset a higher cost of real estate.
» READ MORE: Introducing Rebuilding Philly, a series on creating a more equitable city in the wake of COVID-19 | Opinion
And it gets worse. I also computed these same ratios for our suburban counties, which include South Jersey and northern Delaware in addition to Southeastern Pennsylvania. The average affordability ratio across all 10 suburban counties is 3.5, compared with Philadelphia’s ratio of 4.5. Moreover, every single individual suburban county now has a lower affordability ratio than Philadelphia — indicating that Philadelphia is now the most unaffordable county in the region.
It is important to understand that this is most emphatically not due to Philadelphia having the highest house prices in the region. On the contrary, it has among the lowest (only rural Salem County in New Jersey is cheaper).
And households are reacting to this by voting with their feet. Based upon an analysis of change-of-address forms filed with the U.S. Postal Service since January 2020, Philadelphia has experienced a net loss of approximately 35,500 households, or about 6% of its total household population. The areas that generally experienced the greatest losses were the relatively low-income neighborhoods of North Philadelphia, Lower Northeast Philadelphia, and West Philadelphia — where increased unaffordability is biting the hardest.
It is quite possible that the market will eventually correct this problem on its own. But in the meantime, we should be paying close attention to whether it does this or not — and be prepared to take action if it doesn’t.
If housing unaffordability in Philadelphia continues to increase, the solutions are both simple, yet complex: increase our supply of affordable homes, and/or increase our general level of income. Otherwise, depend on either the market or our elected officials to force house prices to correct themselves. Which of these options do you want to bet on?
Kevin C. Gillen is an economist who holds positions as both a senior research fellow with the Lindy Institute for Urban Innovation and an adjunct professor of finance at Drexel University. He is also a member of the Bright Multiple Listing Service’s Council of Economic Advisors.