Consensus lacking on '08 outlook for housing
The housing market in 2007 has been bad. It seems next year could be worse, although there is little in the way of consensus among experts about how much worse.
The housing market in 2007 has been bad. It seems next year could be worse, although there is little in the way of consensus among experts about how much worse.
Not surprisingly, national housing economists are the most upbeat about 2008, with talk of any possible decline qualified with the words, "Remember, all real estate is local."
The "local-market" defense is supported by Jonathan Miller, director of research at Radar Logic, a New York-based real estate research firm. "There is no 'national' housing market," he said. "Different markets have different risk factors and fundamentals that drive prices."
What's more, "consumers attempt to overlay national statistics on their own property or local housing market, resulting in . . . confusion and frustration," he said.
Miller's calculations show a 2.9 percent increase per square foot in residential real estate prices for metropolitan Philadelphia in September over the same month in 2006. Philadelphia was one of only six metro areas where the price increased, right after New York at 3.3 percent.
Rhetoric aside, next year's course - even in a market like Philadelphia's, generally considered to be less troubled than many others nationwide - is clear to most economists.
"The primary leading indicators of where housing is headed are inventories and days on market," said Kevin Gillen, vice president of Econsult, a Philadelphia economic-forecasting firm, and a research fellow at the Wharton School.
"We have over 12,000 homes currently available for sale" in metropolitan Philadelphia, Gillen said, "more than double the number of two years ago." Average time on market is more than 60 days, he said, "whereas, in a balanced market, it should be 30 to 40 days."
When both supply and time on market start to come down, he said, "that will mean homes are moving again and should indicate that we've hit bottom."
"Of course, the best way to hasten the arrival of that day is for sellers to start dropping their prices," Gillen said, "but they [and their agents] typically don't want to hear that."
Although interest rates on fixed-rate mortgages continue to decline - they are within reach of 6 percent for the first time in two years - cheaper money isn't boosting sales. (Frank Nothaft, Freddie Mac's chief economist, said interest rates drifted lower in November because of bond-market concerns that the housing slump and stress in the credit markets "could slow future economic growth.")
Nationally, the supply of existing homes is at a 22-year high. In response, building permits in October fell 6.6 percent to a seasonally adjusted annual pace of 1.178 million units, the slowest since July 1993, according to Hanley-Wood Market Intelligence, which tracks new-home construction.
Weather and holidays can affect the numbers in month-over-month existing-home sales reports from the National Association of Realtors and new-home transactions from the Census Bureau, and such reports show fewer long-term trends than year-over-year quarterly reports.
Yet national housing-industry economists rely on them even more these days, to keep streaming data to their clients to ease the fears of people who might be ready to buy.
Existing-home data for October showed flat sales in the single-family sector and a decline in condo sales. Lawrence Yun, chief economist for the Realtors' association, said he had expected the sluggish performance; last month, he noted that "temporary mortgage problems were peaking back in August, when many of the sales closed in October were being negotiated."
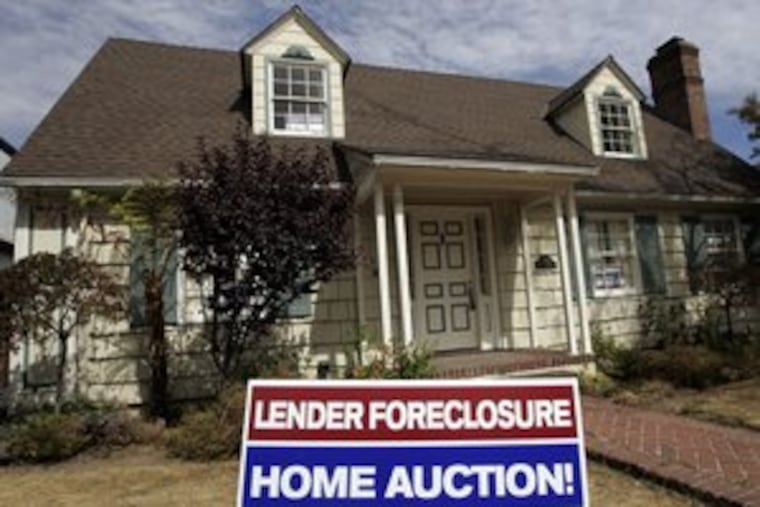
Foreclosures loom large on the national horizon, with RealtyTrac of Irvine, Calif., reporting a 2 percent increase nationwide in October over September. California, Florida and Ohio again led the list, while foreclosures declined 17.04 percent in Pennsylvania and 6.16 percent in New Jersey.
Overall, however, "default notices were down nearly 9 percent in October, indicating that some of the efforts on the part of homeowners, lenders and advocacy groups to find alternatives to foreclosure may be starting to have an impact," RealtyTrac chief executive officer James J. Saccacio said.
Many economists, including Yun, say a further decline in home sales might increase the risk of a recession. Joel Naroff of Commerce Bank in Cherry Hill, noting that October sales in the western states dropped 33 percent from October 2006, observed that the decline "is beyond recession and into the depression stage."
Robert Shiller, cocreator of the Standard & Poor's Case-Shiller Housing Price Index, said he believes that the chance of recession is 50 percent. Global Insights, the Lexington, Mass., economic-forecasting firm, stops short of predicting a recession but says it believes that the economic impact of foreclosures will reduce economic growth, reduce job creation, and affect state and municipal coffers severely.
Richard Gaylord, 2008 president of the Realtors' group, was quick to qualify the October numbers with the "local" argument. "Keep in mind that home prices are up in 93 out of 150 metro areas, and there is a lot of confusion in the market from reports about national data," he said. "Broadly speaking, home prices in most areas are up modestly or fairly stable."
On the new-home side, there was a similar response to Case-Shiller's third-quarter report showing a 4.5 percent decline in prices nationwide (based on 20 metro areas, not including Philadelphia).
"We need to put these numbers in proper historical context by analyzing them over the long term, rather than in one-year increments," said Brian Catalde, president of the National Association of Home Builders.
On Nov. 29, the Office of Federal Housing Enterprise Oversight reported an increase in home prices nationally of just 1.8 percent in the 2007 third quarter over the same period in 2006, but a decline of 0.4 percent from the second quarter.
Nonhousing economists are not optimistic about the short term.
"A bottom will be found," Naroff said, "but it is not here yet. With inventories so high, look for prices to fall even further, even if sales pick up."
Patrick Newport of Global Insight asked, "When will the bleeding stop?" and then answered: "Our view is that prices will drop sufficiently for housing activity to hit bottom in mid-2008. Between now and then, though, home sales may drop more than 10 percent from current levels."
A 1.7 percent spike in new-home sales in October surprised Newport and other economists, but he quickly pronounced it "statistically insignificant" because the Census Bureau's margin of error of plus or minus 11 percent makes it so. Plus, the numbers do not account for canceled orders, "which distort the new-home sales numbers because Census does not revise its recent estimates to account for them," he added.
Consumer spending is down generally; the chief reason is believed to be that too many homeowners tapped too much equity out of their houses when the going was good.
"The negative-wealth effects from declining house prices are inducing consumers to be more circumspect in their spending," Moody's Economy.com chief economist Mark Zandi told an October building-industry conference in Washington. "With consumers also struggling with a less buoyant stock market, rising gasoline prices, and a softer job market, retailers are increasingly worried about the fast-approaching Christmas buying season."
Recent numbers, local and not, make it difficult to see a resolution to the housing market's problems.
As Naroff put it: "That light at the end of the housing-meltdown tunnel appears to be an oncoming train."
Foreclosure Losses Hurt Regional Economies
2008 Revised Loss in Loss of
Real GMP Real GMP GMP
Rank Metropolitan Area Growth % Growth % Millions
1 New York-Northern N.J.-Long Island 2.13 -0.65 -$10,372
2 Los Angeles-Long Beach-Santa Ana 1.67 -0.95 -$8,302
3 Dallas-Fort Worth-Arlington 3.26 -0.83 -$4,022
4 Washington-Arlington-Alexandria, Va. 2.79 -0.60 -$3,957
5 Chicago-Naperville-Joliet, Ill. 2.23 -0.56 -$3,906
6 San Francisco-Oakland-Fremont 1.88 -1.07 -$3,607
7 Detroit-Warren-Livonia, Mich. 1.30 -0.97 -$3,203
8 Boston-Cambridge-Quincy, Mass. 2.16 -0.99 -$3,022
9 Philadelphia-Camden-Wilmington
1.85 -0.63 -$2,597
10 Riverside-San Bernardino-Ontario, Calif. 3.51 -1.05 -$2,372
Gross Metropolitan Product (GMP) is defined as gross domestic product and economic output.
SOURCE: Global Insight for the U.S. Conference of Mayors