Before retailers opened their box of Topps baseball cards in 1952, they were greeted with a letter. These cards — the ones wrapped in green and red wax paper — “were never offered before” and they “would be cherished through the years by every lover of the great American pastime.”
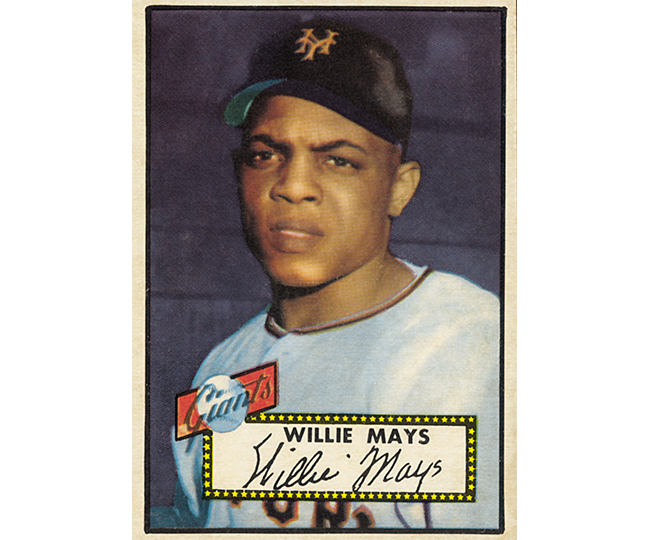
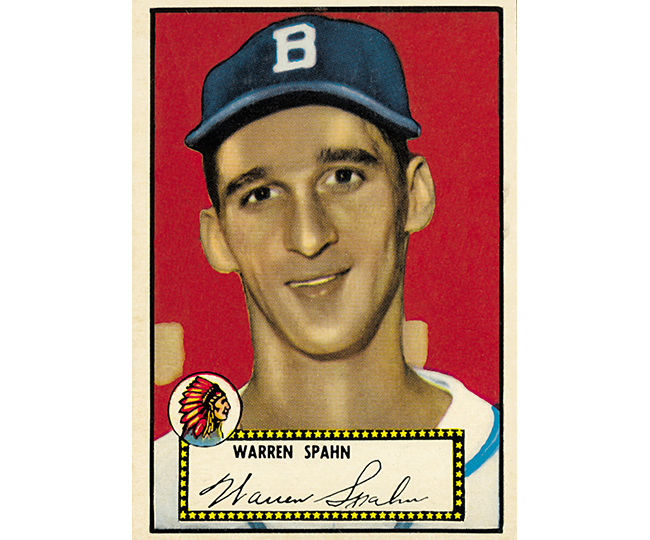
Trying to separate from Philadelphia-based Bowman, Topps made their cards bigger in ’52 for its second series of baseball cards and used color photographs. It added facsimile signatures to the front of cards and each pack sold for a nickel. The set — which included Mickey Mantle’s rookie — would become iconic.
But it is what the company put on the back of its baseball cards that season that changed not only the trading card industry but also perhaps the way baseball is viewed. It is what truly made the cards, as the letter said, like none before.
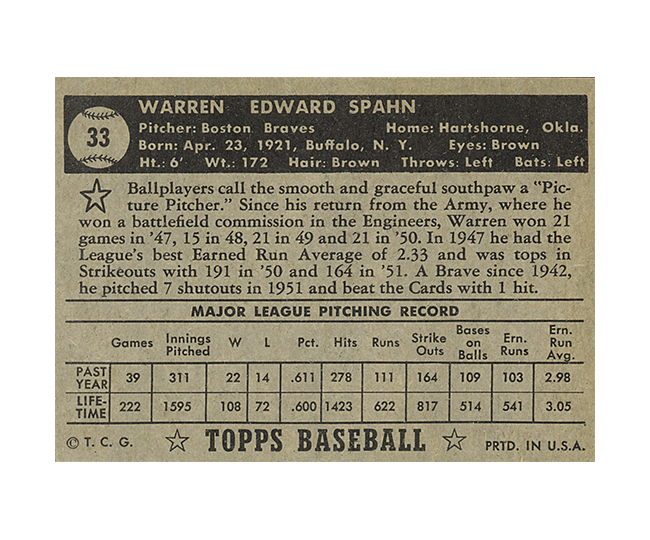
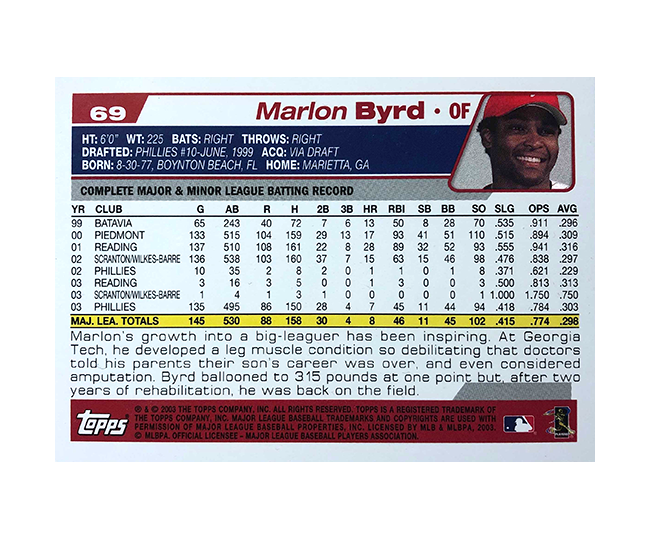
Topps added statistics to the back of cards, becoming the first company to do what is now considered an essential element of a baseball card. This is the 70th season that Topps has printed baseball cards with stats on the back. The stat categories it selected in 1952 have influenced the way baseball is consumed.
More than any other sport, baseball is driven by statistics. And the stats Topps printed in 1952 steered the sport’s conversation for decades.
“I can look at the back of a baseball card and tell you if a guy is good or not,” Phillies manager Joe Girardi said.
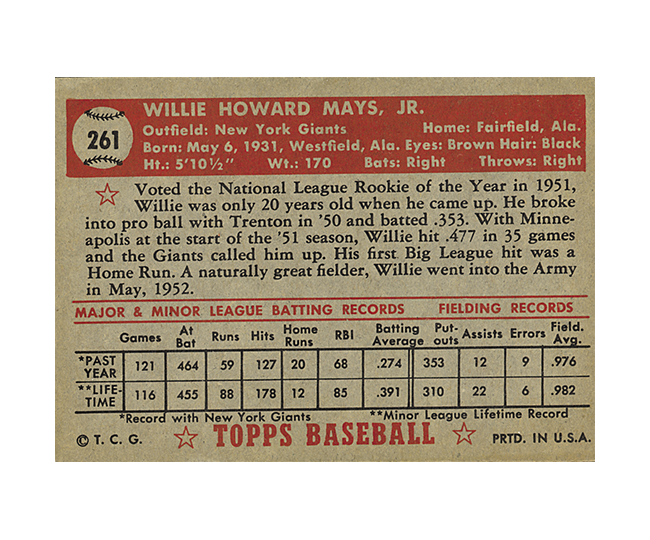
The letter Topps sent to retailers was boastful, but the company was not yet confident enough in its product in 1952 to even put a year on the packaging or the cards. Unsure how the cards would sell, Topps didn’t want to date itself. So the first stat line in the history of trading cards did not say what season the stats were pulled from.
» READ MORE: He thought the pandemic would crush his small business. Instead, his sports card store boomed.
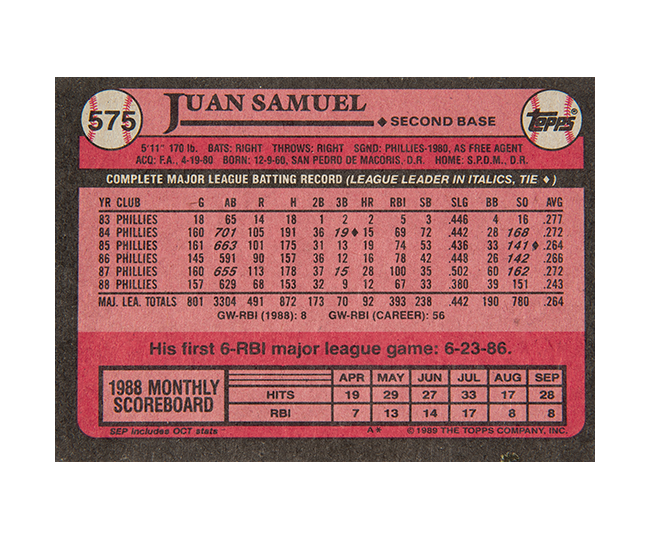
The cards listed 11 statistics for a position player — games, at-bats, runs, hits, home runs, RBIs, batting average, put-outs, assists, errors and fielding average — and provided a pitcher’s games, innings, wins, losses, win percentage, hits, runs, strikeouts, walks, earned runs and ERA.
“I’m sure that we made stats relevant from being on the back of the baseball card,” Topps vice president of global product development Clay Luraschi said. “Stats weren’t easily obtained back then. Baseball cards were kind of a way to have an encyclopedic source of information in your pocket.
“For example, if it’s 1952 and you’re living somewhere in middle America where you’re not even close to a major-league team possibly, now you’re getting Mickey Mantle in full color and with a stat line. At any other time, you’re probably just getting something out of a black-and-white newspaper. Maybe if you’re lucky and you have a TV, you see something. But in that time in 1952, Topps was bringing you as close to the player as any other medium that was around.”
A few seasons ago, a veteran player trying to make the Phillies in spring training told a reporter that the team could simply look at the back of his baseball card if it had any questions about adding him to the roster.
But after 70 seasons, perhaps it’s time to redefine what those stats are. Here’s how we would replace the 11 stats Topps put on the back of cards in 1952.
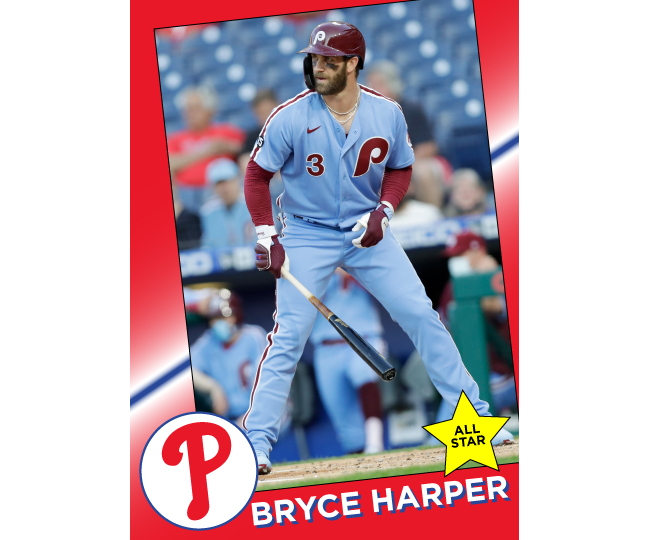

Plate appearances (PA): Forget at-bats, as plate appearances tell a more complete story as they include every time a batter stepped to the plate. At-bats leave out walks, hit by pitches and sacrifice flies.
Walks (BB): Walks occur almost as frequently now as they did in 1952. Last season, a team averaged 3.51 walks per game. In ’52, the average was 3.36. From 2012 to 2015, teams averaged less than three walks per game but last season’s average was nearly a half-walk more than it was in 2012. Bryce Harper’s 148 walks from 2019 and 2020 were the third-most in baseball.
Home runs (HR): How rapid are homers being hit in the modern game? Teams played just 60 games last season, but the 2,304 home runs hit in 2020 are nearly a thousand more than were hit in 1952. The last two seasons have registered the highest home-run rates as teams averaged a major-league record 1.39 homers per game in 2019. The high rate of homers is continuing in 2021. Home runs are staying on the cards.
On-base percentage (OBP): Instead of focusing on batting average, keep an eye on a hitter’s on-base percentage to see how often he is getting on base. Batting average ignores walks, while on-base percentage provides the full package for how a batter can reach.
Slugging percentage (SLG): Batting average weighs all hits as equal, so a single counts just as much as a homer. This is where slugging percentage comes in handy. Harper hit .268 last season, but his slugging percentage (.542) led the Phillies. A higher slugging percentage means a batter is getting more extra-base hits.
On-base Plus Slugging (OPS): Take a player’s on-base percentage and add it to his slugging percentage and you have the preferred metric for judging a hitter’s performance. In recent years, batting average has faded away as there are better ways to judge a player than dividing his hits by his at-bats. OPS gives you a better idea of what exactly a hitter is doing with his plate appearances.
“For me, a guy who typically hits in the middle of the order, OPS is a pretty well-rounded stat. It’s something that I tend to focus on,” said Rhys Hoskins, who had a .991 OPS in last season’s final 25 games. “If you’re damaging the baseball and driving in runs, obviously, you’re going to slug high. We’re going to score a lot of runs if you’re getting on-base so I’ve always looked at OPS. I know there’s a bunch of different stats out there that can tell a bunch of different stories, but to me OPS is the one that I always look at.”
Batting average is no longer in vogue, but it remains on the back of cards. Topps has added stat categories over the years, but rarely does it remove one. Since 1952, Topps has added slugging percentage, stolen bases, wins above replacement, and OPS.
“I learned my first basic math equation from a baseball card. It’s batting average,” Luraschi said. “I wouldn’t say batting average has become insignificant because it’s still important and gives you the basic equation of how successful a hitter is but you can go deeper than that. I think those stats will always be important, especially for someone who is just entering this space and wants a real understanding of what these stats are and what the game is.”
On-base Plus Slugging Plus (OPS+): So Harper led the Phillies last season with a .962 OPS, but how does that number match up against the rest of baseball? That’s where OPS+ comes in. A “plus stat” normalizes the number across the entire league, accounting for external factors like ballparks. A mark of 100 is league average, where a mark of 150 is 50% better than league average. Harper’s OPS+ last season was 160, meaning his .962 OPS was 60% better than the league average.
» READ MORE: Where to buy sports cards in the Philadelphia area
Weighted On-Base Average (wOBA): This measures a hitter’s overall offensive value as it does not treat all hits equally. A double is weighted more than a single, a triple is more than a double, and a home run is weighted the most. It’s similar to OPS, but tries to present a more exact value of what a hitter does. It accounts for how a hitter reached base, not that he simply reached base.
Like OPS, wOBA has become one of the most popular offensive stats in recent years. The Phillies made T-shirts a few seasons ago that said “Chicks Dig The wOBA” as a play on the old Nike “Chicks Dig The Long Ball” commercial. But not everyone digs it.
“I don’t really like stats. I don’t really like any of that stuff,” said Harper, who was on the wrapper of Topps cards last summer and led the Phillies in wOBA. “Exit velocity, I don’t care about that either. I’m more of exit hits. I want guys to get hits. I want guys to perform. I don’t know if there’s one stat. I don’t even understand the wO whatever, I have no idea. I don’t understand any of that stuff. I’m a GED guy. I know if you get on base and your on-base percentage is high, then that’s good. If you hit homers, that’s good too.”
Wins Above Replacement (WAR): It’s not perfect, but it’s usually a good barometer to quickly compare two players. If a player registers a 2 WAR, that means he’s worth two wins over the course of a season above a replacement-level player. Front offices use it each offseason to draw up contracts as 1 WAR can often be calculated to be worth “X” amount of dollars. It’s usually the first stat used by baseball writers when determining who the MVP is or if a player is worthy of the Hall of Fame. Babe Ruth is the all-time leader in WAR with 182.5 and Mike Schmidt is the Phillies’ franchise leader with 106.9. Topps added it to the back of cards 10 years ago.
Weighted Runs Created Plus (wRC+): Instead of runs scored, let’s focus on how many runs a player creates. Runs Created was created by Bill James, the pioneering baseball statistician who coined the term sabermetrics. The metric combines a player’s ability to get on base with his ability to hit for extra bases and then divides it by the player’s at-bats and walks. Like OPS+, wRC+ takes runs created and adjusts the number to account for external factors like ballparks. A wRC+ of 100 is league average. Harper had a 151 wRC+ last season, meaning his 47 runs created were 51% better than league average.
Defensive Runs Saved (DRS): The 1952 Topps cards listed four defensive stats, but DRS — a metric developed by Sports Info Solutions — does a good enough job on its own of telling the story of a fielder. It is the measurement of how many runs a defender saved compared to an average player.
An average player would score zero defensive runs saved, so a positive number is above average while a negative number is below average. Unlike fielding percentage, DRS uses data to take into account how hard a play was to make and how the defense was aligned.
The Phillies, as a team last season, scored a negative 33 DRS, which was the third-worst mark in baseball. In 2019, the Phillies had a 51 DRS, which was the eighth best.
Innings Pitched (IP): A batter has plate appearances, and a pitcher has innings pitched to provide how often they’re used.
Earned Run Average (ERA): This stat seems to be going the route of batting average, but ERA is still a decent indicator of how a pitcher — especially a starter — is performing. The stat isn’t perfect and it’s practically useless for relievers as one bad outing can overly inflate it but it’s still an essential element of the game.
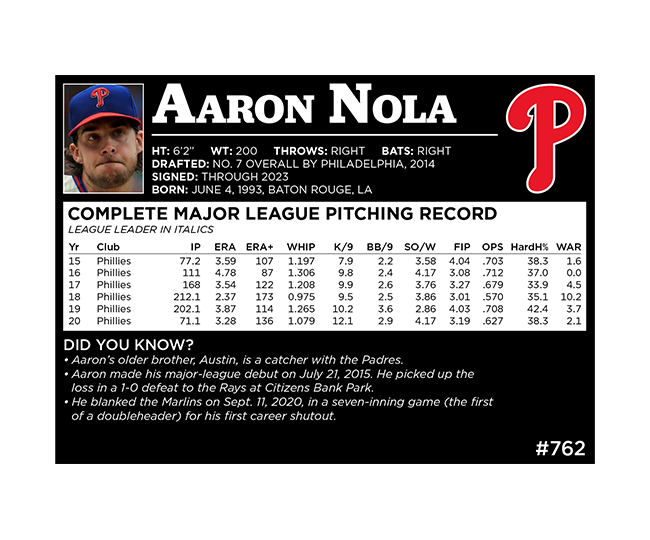
Earned Run Average Plus (ERA+): Jacob deGrom had a 1.08 ERA at the All-Star break. That’s really good, but how good is it? That’s where ERA+ comes in. His ERA+ was 362, meaning his ERA was 262% better than league average. Nola’s ERA+ in 2018 (173) is the third-best in Phillies history.
Walks Hits Per Innings Pitched (WHIP): This stat is simple enough — add up a pitcher’s walks and hits before dividing the sum by his innings pitched — and it also provides a good indication of a pitcher’s performance. A high WHIP means he has long innings with plenty of baserunners while a low WHIP means he’s effective. This stat can be used by both relievers and starters.
Strikeouts Per Nine Innings (K/9): So Zack Wheeler struck out 152 batters this season through his first 19 starts. But using K/9 allows for that strikeout number to be more digestible as he struck out 10.9 batters per nine innings. Nola’s 12.11 strikeouts per nine innings last season is the most by a Phillies starter. Curt Schilling’s 11.29 in 1997 is the highest by a Phils starter in a traditional season.
Walks Per Nine Innings (BB/9): A reliever is obviously never going to pitch nine innings, but this metric still can be applied to the bullpen to show how wild a pitcher is. In 1993, Mitch Williams walked 6.39 batters per nine innings. And that’s why he was the Wild Thing.
Strikeout to walk ratio (SO/W): A team wants pitchers who keep their strikeouts high and their walks low. This stat tracks how well a pitcher is doing that. Zach Eflin is on the injured list with 6.19 strikeouts to walks, which would be the fifth-best mark in franchise history.
Fielding Independent Pitching (FIP): If you’re out on ERA, then you’re probably in on FIP. This metric is similar to ERA but it only accounts for events a pitcher can control such as strikeouts, walks, and home runs while eliminating balls in play. If a pitcher has a low FIP but a high ERA, it could be an indication that his ERA is inflated by bad luck or poor defense and could soon be coming down.

On-base percentage plus slugging percentage against (OPS): If OPS is the preferred metric for hitters, then we should judge pitchers by their OPS against instead of their batting average against.
Hard-hit rate (HardH%): What type of contact is a pitcher allowing? That’s where hard-hit rate comes into play. Wheeler’s hard-hit rate last season (23.1%) was the second-lowest in the National League as he regularly induced weak contact. A hard hit is any ball that leaves the bat at 95 mph or faster.
Wins Above Replacement (WAR): How valuable was Steve Carlton in 1972? He was worth 12.5 Wins Above Replacement for a team that won just 59 games.
