Access to high school sports in Pa. depends on where you live, a new report finds. Here’s a breakdown.
The report from a Philadelphia research group found a link between school funding and sports participation with a persistent gap between urban districts and better-funded suburban districts.
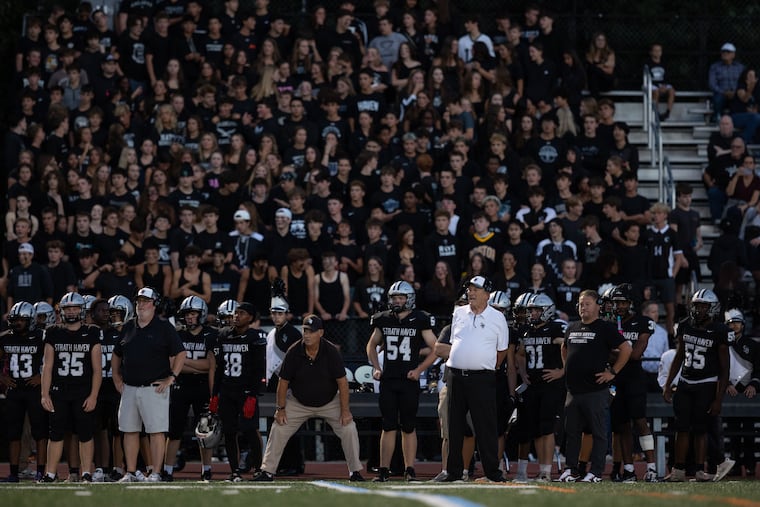
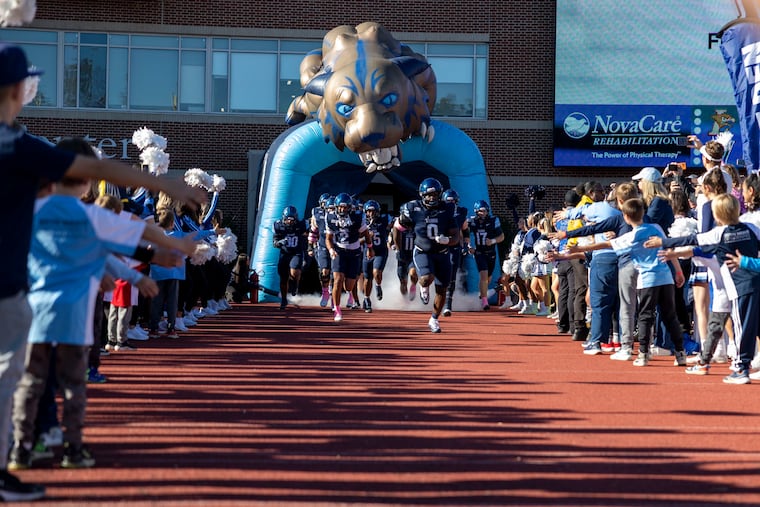
More than 30% of high school students in the affluent Radnor and Wallingford-Swarthmore districts played sports in the 2024-25 school year.
In the Philadelphia school district, less than 10% of high school students did.
The disparities are part of a pattern, with fewer students playing sports in lesser-resourced urban schools, according to Research for Action, a Philadelphia-based educational research organization that released a report Thursday analyzing high school sports participation rates across Pennsylvania.
The report, which looked at sports as another barometer of opportunities available to students, found participation varies widely — as does school spending on sports programs.
It also found a link between funding and sports participation, with more students on average playing in higher-spending districts.
“The degree to which a student may have access to school athletics really depends on what district they’re in,” said Maja Pehrson, the report’s lead author.
Here’s what the report found — and what questions it raises about access to high school sports in Pennsylvania.
There are big differences in sports participation rates
Participation in school sports “hasn’t really been looked at very much,” Pehrson said. Research for Action analyzed data that school districts and charter schools are required to report to the Pennsylvania Department of Education on athletic opportunities.
The report found participation rates in the 2024-25 school year ranging from 5% in some school districts, to a handful of districts with rates above 40%.
Topping the list locally were Jenkintown School District, at 35%, and Springfield Township School District in Montgomery County at 34%; followed by Radnor and New Hope school districts, at 31%; Wallingford-Swarthmore, at 30%; West Chester, at 28%; and Upper Dublin, at 27% — all majority white, relatively affluent districts.
Below the Philadelphia school district’s 9.6% rate were Upper Darby, at 9%; William Penn and Norristown, at 8%; and Chester-Upland, at 6% — all districts that are majority non-white and high-poverty.
Overall, large, urban districts tended to have the lowest participation rates, meaning “almost half of Pennsylvania high school students are enrolled in districts where the likelihood of participating in a school athletics team is relatively low,” the report said.
Those “very low” participation districts — with 5% to 17% of students participating — also offered fewer sports per 1,000 students than high-participation districts, the report found.
Naima DeBrest, a spokesperson for the Philadelphia district, said the district had expanded athletic opportunities in recent years “by introducing new sports such as girls wrestling and girls flag football” and creating intramural programs at the elementary and middle school levels.
Despite “common challenges” faced by urban districts, “the district remains committed to expanding access to high-quality athletic opportunities and ensuring students have meaningful opportunities to participate in sports that support their academic success, well-being, and overall development,” DeBrest said, noting that the district’s rate is comparable to other urban districts.
There are also big gaps in spending
The report found a relationship between money and sports participation rates. Among the 10% of school districts deemed most underfunded by a state formula calculating what schools need to adequately educate students, more than half had “very low” sports participation rates, while more than two-thirds had “very low” or “low” participation, according to the report.
And looking at what districts spend on athletics, it varied widely, the report found. Districts with “very low” participation reported spending an average of $409 per high school student on athletics, while “very high” participation districts — with 28.2% to 61.6% of students participation — spent an average of $939 per student.
Locally, the Jenkintown, West Chester, Phoenixville, and Colonial school districts reported spending more than $1,100 per high school student on athletics, compared with $145 per high school student in Philadelphia.
The report noted that those figures don’t fully reflect spending on school sports. Many districts didn’t report any spending on athletic facilities, for instance; Pehrson said it was likely hard for schools to calculate how much of their overall facilities spending was tied to athletics.
The data also don’t reflect any activities fees paid by students.
Charters have lower participation rates — but in line with Philly
Statewide, brick-and-mortar charter schools, which are publicly funded but independently run, reported lower rates of sports participation. On average, 8.4% of charter high school students participated in sports, compared with 18.1% in district schools. (Cyber charter schools reported no participation; charter students who participate in district programs are counted by districts.)
Rather than a difference between the charter and district sectors, however, the gap could largely be a product of school district conditions, the report said. Half the state’s charter high schools are located in Philadelphia, where the charter sports participation rates largely mirror the district’s, the report said.
Gender gaps persist
Boys participated in sports in 2024-25 at a higher rate than girls — at an average rate of 20.3% compared with 15.8%, the report found.
And those gaps persisted across different types of school districts, the report found. For instance, in districts with “very low” overall sports participation, 14% of boys participated, compared with 10% of girls. In districts with “moderate” participation, 24% of boys participated, compared with 19% of girls. And in “very high” participation districts, 35% of boys participated, compared with 30% of girls.
What’s driving the disparities?
The report found that access to high school sports in Pennsylvania “is not evenly distributed and is strongly shaped by structural conditions.”
“Districts with fewer athletic opportunities are more likely to be urban districts with large high schools and more students of color, and they tend to offer a narrower range of teams and spend less per student on athletics, limiting the extent to which students can engage,” the report said.
But district funding alone isn’t responsible for disparities, the report noted. The gender gap, for instance, is found in well-funded and poorly funded districts.
The pattern of higher-spending districts seeing more participation “doesn’t line up neatly for every district,” Pehrson said, noting that the data can’t fully answer questions about what’s driving differences in participation.
Other possible factors could include transportation and sports outside of schools, Pehrson said.
DeBrest, the Philadelphia spokesperson, noted that urban districts may also have limited athletic facilities, and practice space “and the need for some students to balance academics, work, or family responsibilities.”
Pehrson hopes the findings prompt more investigation into the availability of school sports, which “are a key part of students’ educational opportunities,” Pehrson said — from boosting physical and mental health, to promoting social-emotional skills and building community.
“There are clear disparities in terms of sports opportunities students are having,” Pehrson said. “Why is that, and how can we move forward and try to figure out these differences?”
Editor’s note: This story has been updated to reflect that Jenkintown and Springfield Township were the local districts with the highest sports participation rates.